
Subscribe
Sign in


Launched on March 8th, 2018
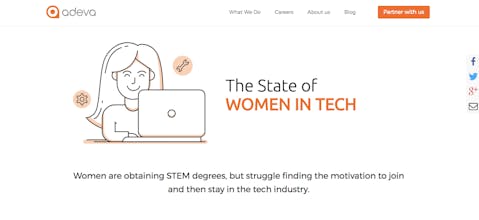
This is an animated infographic that shows relevant data about the status of women in tech for 2018. The stats are gathered from different sources, addressing 6 main pillars:
Education 📚
Workplace 🏢
Earning 💰
Leadership 💪
Top Barriers ⛔
Global Initiatives 🔧
The infographic is embeddable and you can place it on your web page as well.


