What is GitHut 2.0?
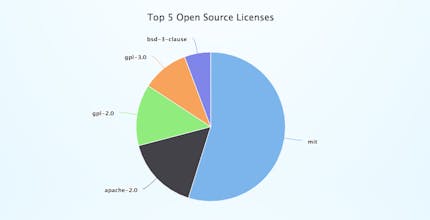
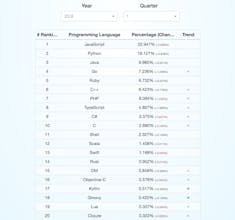
GitHut 2.0 is an attempt to proceed the githut.info project. The project did not received any update since 2014/Q4, that is mainly due to the fact that Github Archive changed its datasets. GitHub is the largest code host in the world, with 20 million users and more than 57 million repositories as of April 2017. By analyzing how languages are used in GitHub it's possible to understand the popularity of programming languages among developers and to discover the unique characteristics of each language. GitHub provides a public API to interact with its huge dataset of events and interaction with the hosted repositories. GitHub Archive goes a step further by aggregating and storing the API data. The quantitative data used in GitHut 2.0 is collected from the GitHub Archive dataset via Google BigQuery. The GihHub Archive dataset can be accessed by queries that are syntactically almost the same as SQL queries, with exception of some additional functionality provided by Google. Google provides a free query limit of 1000 GB per month. The query volume is calculated very precisely, it only counts the data that you actually access, regardless of the overall dataset size. This allows you to query datasets, even in the case that they are much bigger than the free query volume. The free query limit is therefore sufficient for the purpose of this Website. You will find the queries that are used to calculate the statistics in the README.md. However if you don't like the idea of using a Google Service for any reason, you can also download the files from the GitHub Archive and process them manually. The statistics are updated on a quarterly basis. The language percentage distribution in the line chart shows the top 10 languages since 2012/Q2. The ranking table shows the top 50 languages based on the last quarter, while the trend is calculated as difference from the same quarter of the year before. The percentage gives the actual fraction of Pull Requests, Pushes,.. in relation to the top 50 languages shown in the table, consequently summing up all fractions in the table results in 100%. The change shows the difference of the percentage compared to last years value, as for example year 2016 percentage plus year 2017 change equals 2017 percentage. The trend arrows indicate the change in ranking. Two up arrows stands for more than three ranks up within one year. No arrow indicates that nothing has changed, consequently one up arrow fills the gap. The down arrow definition is analogue. Please note that it is possible that the ranking shown in the table does not match the chart ranking, since they are calculated over a different time period (quarter vs. full history). Please also note that there is not enough data available in the GitHub Archive dataset to calculate a statistical accurate ranking table or chart for any time period before 2012/Q2.